March 22, 2009

Fuchun Yu in 1994
at the age of 80
| Biography of Fu Chun Yu
Through a lucky coincidence - and thanks to Internet - there now emerged many details about the life of the eminent Chinese physicist who worked with Felix Bloch at Stanford in the very early days of NMR and, together with Warren G. Proctor, discovered the chemical shifts (see my blog entry regarding this topic). The two youngsters also observed for the first time a J-coupling, though they did not quite understand what it was. Together with F. Alder, Fuchun Yu also determined the spin of the 17O nuclide which turned out to be unexpectedly high (5/2), a fact which prompted a substantial revision of the then prevailing nuclear structure theories.
But the biography of Fuchun Yu, now published in Stan's Library, represents above all a unique glimpse of the complexities of modern Chinese history, and a touching account of the personal destinies of a highly intelligent person trying to cope with them. What so far has been just four anonymous letters (FC Yu) suddenly comes to life, acquires a human fullness and becomes a complex saga.
|
March 15, 2009
Amazon links:
M.R. Brustolon
E. Giamello
Editors
W.R. Hagen
K. Moebius
A. Savitsky
| New EPR (ESR) books
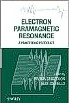
This month three Electron Spin Resonance books have become available, which is a quite unusual peak. Two of these had been planned for a release in 2008 but then either rescheduled (Brustolon - Giamello) or just delayed (Hagen). There are two more delayed 2008 ESR books still in the pipelines and another two are scheduled for the next two months (see my list of ESR books). Which means that the current year should break all records in ESR publishing! The three titles which have just reached the distribution channels are:
Principles and Applications of Electron Paramagnetic Resonance Spectroscopy,
Edited by Marina Rosa Brustolon and Elio Giamello, published by Wiley.
This book represents a pragmatic guide to navigating through the maze of EPR/ESR spectroscopy fundamentals, techniques, and applications. In other words, if you are about to operate an ESR spectrometer and carry out actual measurements on your own, this is what you should read first. Contributions of 18 Authors had been carefully stitched together by two Editors, themselves foremost Italian EPR scientists, each with decades of practical experience.
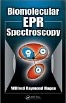
Biomolecular EPR Spectroscopy
by Wilfred Raymond Hagen, published by CRC.
Unlike most bio-whatever books, this one does not just mention EPR. It takes a broad view of the whole area specifically from the EPR point of view and covers all important bioEPR applications, including low-spin and high-spin metalloproteins, spin traps and spin labels, interaction between active sites, redox systems, etc. It is loaded with practical do's and don'ts based on the Author's 30 years of experience and contains also an unprecedented set of software utilities which allow readers to tackle many problems of spectral analysis.
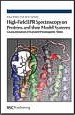
High-Field EPR Spectroscopy on Proteins and their Model Systems:
Characterization of Transient Paramagnetic States
by Klaus Möbius and Anton Savitsky, published by RSC (Royal Society of Chemistry).
This opus offers an overview of experimental techniques in high-field EPR spectroscopy applications to biology and chemistry, focusing on the use of the technique in conjunction with site-specific mutation strategies and advanced quantum-chemical computation methods to reveal protein structure and dynamics. The theoretical and instrumental background of high-field EPR is described using examples of paradigmatic protein systems, such as photosynthesis. The information obtained complements that obtained from protein crystallography, solid-state NMR, infrared and optical spectroscopy. Unique features include comparisons of information content of EPR, ENDOR, Triple resonance, ESEEM and PELDOR taken at different microwave frequencies and magnetic fields.
All three books are similarly priced and fall into the $100 category - which is not too bad, considering the relatively small size of the EPR market.
|
March 11, 2009

2D MRCDI image
of a 0.4 mA pulse in
a conducting channel
| Imaging of electric currents by MR
John Nieland from Denmark sent me this query:
Dear Stan, I have read your NMR website and would like to ask you a fundamental question.
I am a chemist so I know the ground principles of NMR. My question concerns electric currents. When you measure a tissue for instance and would put an electric current on this, then the current will have an influence on the spin. Alternatively when you measure a tissue in an NMR machine and then make an electric pulse go through the tissue will you be able to measure that and the other question will you be able to see the direction of the current? I was thinking of if it would be possible to measure electric currents being transported in nerve tracks? I am looking forward hearing from you. Best regards, John Nieland
Nice ideas, John, but you come too late! Magnetic Resonance Current Density Imaging is an established technique known as MRCDI. It has a number of limitations, however, the most important one being that the current distribution must be either static or, when transient, at least synchronized with MRI scans. Which means that imaging of the currents in neurons - a feat which was certainly often pondered - is presently impossible because they occur in tiny and apparently random bursts lasting just a few milliseconds.
The MRCDI technique is based on the fourth Maxwell equation according to which in static situations one can compute the map of the current density j as the curl of the magnetic field B [specifically, j = ∇ x H = (∇ x B)/μ]. MR permits us to measure, with extreme precision, only the spatial distribution of the z-component of the vector B (one can say that magnetic resonance is born axial). To obtain all three vector components of B, one must rotate the sample (patient) with respect to the magnetic field (or vice versa) and measure it at three mutually orthogonal orientations. This is another big limitation of MRCDI - one with which they are still fighting, I believe.
MRCDI can be combined with another tomographic technique known as EIT (Electrical Impedance Tomography) which uses arrays of surface electrodes to measure apparent surface resistivities and then computes 2D or 3D images of bodies in terms of electric impedance (medicine has borrowed this one from geophysics, where it is known as electric resistivity surveys). When combined, these two techniques complement each other - the MRCDI data, though incomplete due to the axial character of MR, supply a much needed set of constraints to the EIT. The combination goes under the acronym MREIT.
You will not find much about these methods in Wikis since they are still very much "work in progress". But they start showing up on internet search engines so, if you wish, you can enjoy yourself. There is a nice and free article about MRCDI (you can also click the image on the left to get it) and another one about MREIT by a group of researchers at University of Ankara, Turkey.
|
March 8, 2009
Sunday
supplement


| Magnetic resonance and spinning tops
Time ago I was trying to explain NMR to a young electronic engineer who has never heard about it until he was called upon to build it. We were proceeding well, but I was aware that something was missing. I was of course talking a lot about when and why the Larmor precession becomes faster or slower, until I noticed that every time I used the term, the chap's eyes became kind of unfocused. I asked, and it turned out that he has never played with a spinning top and had no idea what precession really was. So the next time I brought with me a small gyroscope and showed him the secret making it spin atop a pencil tip with its axis nearly horizontal. It maintained that configuration for just about five or six turns but that was enough. I still see how his eyes suddenly brightened when, before the gyro completed its second turn, the fog has lifted and all the mysteries were suddenly gone.
The story shows how important it is in elementary courses to actually show something that introduces the basic idea. The magic of precession can not be conveyed mathematically - it must be seen! And never mind how imperfect the demo might be. Later on you can always make corrections, underscoring the fact that, unlike normal objects, quantum particles can never stop spinning.
The best is of course a real demo using a real object such as a toy gyroscope or a bicycle wheel. Lacking that, one can resort to a video. There are quite a few of those on the internet but since not all are really up to the task, I have selected just the three which I like most (click on the images on the left). Have a look at them and, if you are starting an NMR or ESR course, make sure your students see them before you utter the words magnetic resonance.
For more about gyros, consult How stuff works or visit the true gyroscopes buffs. Quite nice is also an Italian article about trottola (Italian for spinning top) which discusses its uses in ancient Greece and Rome, pre-columbian Americas, and other places in space and time.
|
March 4, 2009
| Let's discuss NMR spectra evaluation and interpretation
If you are planning to attend the anniversary 50th ENC Conference, I would like to invite you to the Mestrelab pre-ENC User meeting which will take place on March 29 (Sunday afternoon). I am aware that this collides with a number of other pre-ENC meetings running in parallelel - and I am also aware that this announcement may look as a commercial promotion.
However, I am an independent collaborator of Mestrelab, not an in-house guy. I like the young team, but that does not mean that we always agree on what should be done, nor in which order. They have offered me room for two 20' talks, entitled
- Global Spectra Deconvolution (GSD):
present performance and the brave New World it opens.
- From spectra to Spin Systems: where do we stand.
and I will talk primarily, but not only, about my own contributions in those areas. Needles to say, you are all welcome, no matter whether you use the Mnova or not. Moreover, I promise to limit my presentations to just half the allotted time and reserve the rest for an informal, free discussion which will no doubt draw-in also other experts. If you are interested in computer-aided or fully automatic evaluation and interpretation of NMR spectra, I am sure that we can have a great time and there are excellent chances that all of us will learn something new and useful.
You are also invited to meet me and Carlos Cobas at our ENC poster.
|
March 2, 2009
This is part of the
Know Thy Spins
series.
| Are NMR spectra worse today than they used to be?
Andy Mahon has mailed me the following query:
Hi Stan, just a simple question. Why is it that when spectra are acquired at higher frequency peak resolution is better, but multiplicity is not? Thanks, Andy.
Andy, your question may be too simple for a simple answer! I wrote you back asking for additional details but you did not reply. It would be nice to know what spectra are we talking about (1H, 13C, ...) and what exactly you mean by a "peak" and by "multiplicity" and by the multiplicity being "worse" or "better". In any case, I suspect what you might have in mind and will try to give you an answer. If I misinterpreted your question, you can always write me back and put me on the right track.
Consider the aromatic portion of the proton 400 MHz spectrum of strychnine shown below. It corresponds to the four protons attached to carbons 1,2,3, and 6 in the shown formula. The four multiplets corresponding to these protons (respectively at 7.07, 7.25, 8.07, and 7.16 ppm) are isolated from each other. For anybody with a bit of experience, the "interpretation" of this portion of the spectrum is almost trivial. It leads first to the realization that we have here a four-spin system with the 3J coupling pattern of the linear type A-B-C-D, which becomes totally coupled once we consider also the 4J and 5J couplings. The subsequent match between the spin system and the molecule based on the multiplet patterns and on empirical prediction rules is also simple and leads to the assignment A="3", B="2", C="1", D="6", as indicated in the Figure (there is no need to measure any 2D data to assign a spin system to this spectrum).
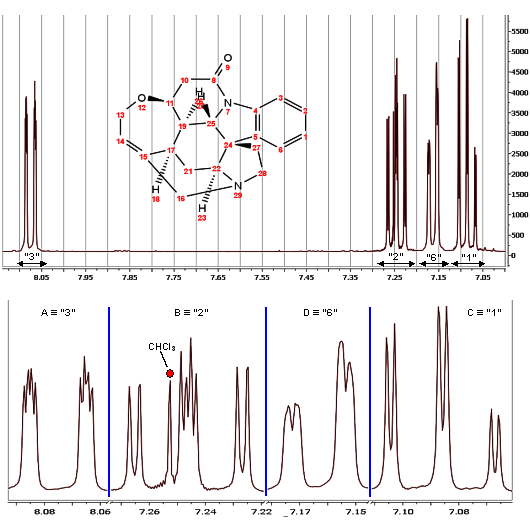
But let us return to your question. I suspect that what I call "multiplets", you call "peaks" because there is in your mind the chemist's ideal association between a chemically distinct hydrogen atom on one side and a peak in the spectrum on the other side. This, however, is overly simple and untenable. At best you might speak about "spectral bands", which are the same thing as my "multiplets". I also believe that when you say "multiplicity", you mean each multiplet's detailed structure. Such as, in this case, the crude pattern of each multiplet due to the large 3J couplings being either a doublet (multiplets "3" and "6") or a triplet (multiplets "1" and "2"). Then, when the small long-range couplings are taken into consideration, the multiplets split further, showing almost all the expected main transitions (strong spectral lines) which in a four-spin system should be eight per multiplet [2^(n-1)]. This is why, looking at multiplets "3" or "2" with their eight resolved lines, I know that they belong to a coupled 4-spin fragment (the marked line at 7.253 is the solvent). However, in multiplet "1" two pairs of lines coincide, indicating that J(1,2) and J(1,6) are indistinguishable, and in multiplet "6" the smallest 5J(6,3) splitting is unresolved, and possibly also intertwined with the tiny 5J couplings with the two protons on carbon 27. By the way, this description of multiplet patterns does not follow the sometimes misguiding shorthand (like "ddd", "td", etc) used in chemical literature. For example, multiplet "2" has a very clear and resolved structure of 2+4+2 lines, but I would be at a loss to encode it in any of the ways in current use (maybe we should coin a new letter for it).
Now, what would happen if we measured this spectrum at a different field (frequency).
Let us first suppose that we go to a 200 MHz spectrometer. Clearly, the three multiplets on the right would nearly overlap. This, I guess, you would label as the 400 MHz spectrum being "better resolved" than the 200 MHz one. However, you should say chemically resolved rather than just resolved because in NMR the term resolution has several different connotations (when used without any extra specification, it indicates magnetic field homogeneity which is not what you had in mind). Another effect we would observe at a lower field is that the intensity discrepancies (the second-order roof effect) inside the individual multiplets would become more pronounced making, for example, the rightmost doublet of "1" and the leftmost doublet of "6" appear relatively about half of what they are in the 400 MHz spectrum.
On an 800 MHz, the multiplets would appear much better separated from each other than in the spectrum shown above and the relative intensities of all the main transitions would be closer to the first-order approximation in which they are all equal. However, since we plot the spectra on a ppm scale (not in Hz), we actually normalize them so as to make the centers of all multiplets fall always at the same horizontal location, no matter what spectrometer we use. But the couplings, unlike the chemical shifts, are absolute and not proportional to the field. The net result is that while the centers of the multiplets appear fixed on the ppm scale, their overall widths appear to vary inversely to the spectrometer's operating frequency. To a physicist, this is an illusion since the natural units for multiplet patterns are Hz (an absolute unit) and the absolute multiplet width does not vary at all with the spectrometer field - it is always well approximated by the sum of the absolute values of all the couplings in which the multiplet participates. Even the fine details of each multiplet's structure do not vary too much with field, except for occasional second-order effects such as the above-mentioned relative intensities of main transitions.
To a chemist, however, this illusion is a reality! When he doubles the spectrometer frequency, it looks to him simply as though each multiplet's neighborhood had been reduced in width by a factor of 2. So while this makes multiplets better separated from each other, if he wants to describe their coupling patterns with the same accuracy as before, he must compensate the apparent reduction in width by "zooming in" again.
Here we finally come to the core of my answer and, hopefully, also of your question. The above "chemist's illusion" has a negative side effect which consists in the "psychological" tendency to digitize spectra (and FID's) using the same number of data points at all spectrometer frequencies. Spectrometer users tend to think: if my spectral window is always 12 ppm, why should I not take always 32K data points!? But this is completely wrong and, when accepted in practice, leads to the mis-perception that while at high fields multiplets are chemically better separated, their coupling patterns are worse defined!
To understand this better, suppose that two spectrometers, one operating at 200 MHz and one at 800 MHz, have the same magnetic field homogeneity permitting to resolve peaks 0.4 Hz apart (this is a quite universal manufacturer specification which has not changed over the last 30 years). In order to "digitize" such splittings, we need a data point at least every 0.1 Hz (this defines the "digital" resolution of a spectrum). Now suppose that we want to cover a range of 10 ppm which amounts to a spectral window (SW) of 2 kHz for the 200 Mhz instrument. Clearly, in order to exploit the available resolution, we need 2000/0.1 = 20K data points. A wise operator will therefore opt for 32K complex data points for the spectrum. For the same reason, however, this would be absolutely insufficient on an 800 MHz machine where the SW is 8 kHz and therefore at least 80K data points are needed, commanding 128K complex spectra. Admittedly, one can use only a fraction of the data points for FID's and compensate by zero-filling before the Fourier Transform, but that provides "new" information only for zero-filling factors up to 2, thereafter it just interpolates.
In any case, I far too often encounter woefully under-digitized high-field spectra, which is absolutely unpardonable. Considering the infinitesimal cost of memory today and the fact that repetition rate is dominated by relaxation times and not at all by the scan size, an under-digitized spectrum amounts to money thrown out of the window. The 400 MHz spectrum shown above was acquired (not by me!) using SW of 16 ppm and just 16K complex data points! Looking closely at the multiplet expansions one sees that, even though it has been zero-filled to 32K, there are just about 4 data points per line! Under these conditions, trying to assess lineshapes, get reliable multiplet integrals, do a multiplet deconvolution, or measure with any accuracy the values of long-range coupling constants is nearly impossible.
But what I have said so far is not really the whole story. First of all, it is not surprising that to reach a certain homogeneity at a high field is technically more difficult than to reach it at a lower field. In the 70's when a typical instrument had an electromagnet and operated at 80 to 100 MHz, we used to see routinely half-height linewidths smaller than 0.1 Hz. I have prided myself on being able to shim instruments like the Bruker WP80 to 0.07 Hz in less than 30 minutes, even though the spec was much higher. On todays supercons the specification is 0.4 Hz and, using the automatic shimming, it can be reached in about an hour. But I wonder how many people, if any, have seen lines narrower than 0.2 Hz on an 800 Mhz instrument!
There is also the question of the magnetic field spread associated with temperature gradients within the sample. A typical solvent susceptibility is of the order of 10 ppm and it is proportional to 1/T. Which means that a mere 1 degree temperature variation across the sample will cause a magnetic field spread of the order of 10/300^2 ppm. At 800 MHz, this amounts to an exorbitant 0.8 Hz/degree! When the temperature gradient in the sample is constant, the shimming will compensate for its effects, but what if you first shim and then do something that affects the temperature gradient, like change the sample temperature setting or the flow rate of the VT carrier gas? One should also make a similar analysis regarding the magnetic susceptibility of the sample-tube and that of the various components of an operating probehead.
So, in the ultimate analysis, Andy, you are right. The higher we go with the field, the more demanding it is to achieve and maintain reasonably small linewidths. Statistically speaking, while chemical separation improves linearly, the definition of multiplet patterns tends to become a bit worse. One consequence is that the highest field instruments are not always the best ones for solving the molecular structure problems of small and medium size molecules.
COMMENTS:
March 5, 2009: Carlos Cobas
Stan, I have complemented your article on my blog by several illustrations of the "chemist's illusion" you are mentioning.
|
February 27, 2009
Courtesy MR-TIP
| Average throughput rates of MRI scanners
On January 21, Gale Pierce has mailed me this query:
Hello Stan, I would like to know, approximately how many MRI scans are done on a monthly basis at any one MRI facility? Rough estimate, of course. Thank you, Gale Pierce.
Dear Gale, I am sorry it took me so long to react, but it is not easy to find out, and the numbers vary a lot from one place to another.
On a sessions-per-scanner basis it is anywhere between 10 and 30 sessions (patients) a day. There are machines exploited around the clock and then there are those used only half the time. Much depends upon the organization of the whole facility, which can have any number of scanners. The most important factor appears to be patient preparation which should be done in parallel in separate rooms prior to getting anywhere near a scanner. Another important factor is the type of data to be acquired - some facilities concentrate on a screening-like routine, others do more in depth, specialized assays.
While some types of images (not all!) can be obtained in less than a minute, a typical session takes anywhere between half an hour and a couple of hours, compatibly with patient preparation and positioning time, instrument setup and tuning (this is patient specific), the particular type of assay to be carried out, the state and cooperation of the patient (anaesthetized, sedated, wakeful, claustrophobic, infant, ...), the use of any particular contrast agents and the modality of their deployment, and the need for any exploratory scans as opposed to clean scans (the number of scans per session deemed good and significant enough to be archived is typically anywhere between 1 and 10).
Most facilities specify 20-45 minutes per session which, for standard scanning, is a reasonable specification to hand out to the patients, but it is nearly impossible to maintain as an overall operating average of the facility.
Then there are daily check-up and calibration times, monthly regular maintenance, and any down-time due to technical trouble-shooting.
To sum it up, the facility's overall organization affects the average throughput of each scanner much more than the scanner's capacity to produce scans. So if you think you are a good manager, you might try to plan 20 sessions a day. Afterwards, if you manage to get more, you merit a medal. But if you get less, don't despair, you are in good company!
|
February 25, 2009

Robin Harris
visibly enjoys NMR
crystallography

Csaba Szántay
describes the scary
human factors in
molecular structure
elucidation through
NMR spectra

Jan Stanek
receives the prize
for best poster
More Photos
by Damjan Makuc

Ivano,
the sunburnt one
is YOU ???
| Glimpses of MMCE 2009
Almost two weeks passed since my return from the meeting Magnetic Moments in Central Europe - hopefully enough time to let my subjective impressions relax towards objective memories. The meeting should become a new bi-annual event to be held in various places in Central and Eastern Europe. This kick-off edition was held February 11-15 in Slovenia, exploiting economically convenient and yet high-quality accommodations at the Krka Spas in Otocec, halfway between Ljubljana (Slovenia) and Zagreb (Croazia). The next edition in 2011 will take place in Slovakia in the High Tatra mountains.
The meeting was organized by the Slovenian NMR Centre (National Institute of Chemistry, Ljubljana), one of the two largest NMR groups in Slovenia (the other one is at Jozef Stefan Institute, also in Ljubljana). As far as I can tell, the organization was absolutely smooth and spotless. Apart from a unique candle-light dinner at the not-yet-restored Struga Castle and a live dance-music at Saint Valentine's night, the rather isolated location on river Krka offered few distractions and was conducive to hard work and study. I have particularly appreciated the fact that, with its 140 attendees, the size of the meeting was still not too large to require parallel sessions.
Besides a most interesting pre-conference session (a new twist to me), there were six sessions dedicated to Residual Dipolar Couplings, Biomolecular NMR (dual), Fast and Novel NMR Methods, Applications of NMR to Small Molecules, Polymorphism and Solid-State NMR, and Hardware and Software News. Enough for everybody to find something exciting. The invited speakers were asked to structure their talks more as tutorials than as presentations of new results, and I think that in this sense they have done a great job. They included Marc Baldus (protein function by HR-NMR), Ivano Bertini (he talked about NMR and cellular copper pathways in a way even I could follow), Bernhard Brutscher (protein NMR tools), Lucio Frydman (ultra-fast NMR techniques), Robin Harris (NMR crystallography and polymorphism), Oscar Millet (protein structure), Ago Samoson (father of the double-axis MAS rotor), Harald Schwalbe (biomolecular dynamics), Vladimír Sychrovský (ab-initio calculations of NMR parameters) and Dušan Uhrín (residual dipolar couplings).
Given my own engineering and software background, I have enjoyed most the session on Fast and Novel Methods (in particular Lucio Frydman's talk) and the Hardware and Software News where I have contributed with my and Carlos Cobas' presentation modestly entitled Peak Shapes in NMR Spectroscopy, but immodestly dealing with the now operative Global Spectral Deconvolution. But there was not a single session where at least some presentations would not stimulate my gray cells! I also want to mention one person whom I did not know and who impressed me a lot, namely Csaba Szántay from Hungary. His talk On the "Philosophy" of Small-Molecule Structure Elucidation by NMR: the Human Factor was a most enjoyable distillate of wisdom (apart from being directly pertinent to my current work as a programmer).
There was also a poster competition, won by Jan Stanek for a poster about The Iterative Approach to Processing of Randomly Sampled Multidimensional NMR Spectra. Jan comes from a Warsaw University NMR group which includes the co-author of the poster (Wiktor Kozminski) and others (Krzysztof Kazimierczuk, Anna Zawadzka, ...). They investigate the white-hot topic of novel data-sampling strategies which are about to drastically reduce the total acquisition times of many multi-dimensional NMR spectra. The prize consisted of a free registration for the next MMCE and a bottle of wine :-)
To sum it up, I have really enjoyed this meeting and look forward to the next one. Though I live in Italy, my birthplace entitles me to the Central European label. This, by the way, is a point the Organizers should specify better: for example, does it count that Italy, while not Central European, is central for Europe? Which reminds me of another amusing impression I collected on this trip: the inhabitants of the Krka region in Slovenia are apparently the only ones perfectly satisfied with the current state of the World. They mostly own small family vineyards, produce their own [somewhat acid] wine and take life - including the economic crisis - with detached philosophy, professing that "now" they are quite happy. After the incessant self-pitying and wailing of the Italians, I have found this attitude most refreshing.
Post-script:
The MMCE conference was preceded by a one-day meeting of EAST-NMR, a new EU initiative (project n.228461 of the FP7-2008-Infrastructure-1) which has contributed to the MMCE funding. Nobody can pronounce the full title of EAST-NMR (it is nearly as long as the defunct draft of EU Constitution) nor find its web page, but it should apparently help people to move around the European Large Scale NMR Facilities. From its logo (shown on the left) it seems that UK and France are its members, so the "EAST" in its name is an acronym, not a geographic indication. Nor is it strictly EU, since Turkey is in, while the Scandinavians and Iberians are not! It looks like one of those EU-commissar dealings which the EU parliament knows nothing about. Strange things indeed ...
Ok, here comes the title: Enhancing Access and Services To East European users towards an efficient and coordinated pan-European pool of NMR capacities to enable global collaborative research and boost technological achievements.
|
January 31, 2009

Click for notes
| Are MRI and NMR drifting apart?
Recently, I perceive a mounting swell in the tendency towards splitting magnetic resonance imaging (MRI) from the rest of magnetic resonance (MR). Some of the imaging folks have virtually no contact with NMR spectroscopy and thus tend to identify MR with "the thing you do in the hospitals" or, worse still, promote ideas of the type "MR can do without quantum mechanics". Of course, they deal mostly just with Zeeman interactions and spin 1/2 nuclides, a fact which has many consequences, one being that their everyday routine may look a bit boring to a few (not all) physicists or chemists. In addition, research in MRI is recently ever more focused on functional MRI (fMRI) and interventional MRI, areas where Hamiltonians and product operators are totally unknown.
Yet, I am sure that this is bound to change dramatically and that accepting a schism between MRI and the rest of MR would be detrimental to both NMR and MRI. Two decades ago, something similar was happening in NMR spectroscopy. There were many chemists who totally identified NMR with "so many milligrams of a substance dissolved in half a milliliter of a deuterated solvent and giving a spectrum with a number of sharp spectral lines". They had little use for NMR relaxometry (much less for its variable-field techniques) and could not even conceive of NMR at low fields and/or with linewidths exceeding 10 ppm or so. Today, such a split seems unlikely since most chemists have learned to respect other NMR techniques and to apply them in their own fields. Molecular structure determination, the NMR staple of 60's through 80's, is still extremely important in many application areas (drugs development, natural products, chemical synthesis backup) but it no longer dominates large NMR meetings such as ENC or EUROMAR. Likewise, protein structure determination, which for a couple of decades occupied a vast segment of the NMR horizon, seems to have peaked-out and is acquiring a routine status. When I wonder what the next great, hot area of interest will be, what comes most easily to my mind is spectroscopic MRI (sMRI).
Unfortunately, we were unable to prevent the splitting away of ESR (alias EPR) which dates back about 15 years. In all Countries, the ESR folks complained about not being given enough space and attention and created their own Associations. Personally, I think that this was unfortunate and that it impoverished everybody. Especially since the second item on my list of potential Next-Hot-MR-Things is simultaneous, craftful excitation and acquisition of signals from different nuclides - and from unpaired electrons as well, whenever they are present! Whatever we do to it, a sample should be always monitored on all frequency channels which might contain a signal.
It is true that the range of magnetic resonance techniques and applications is extremely broad and that it is difficult for any single person to cover the whole of it. Understandably, this generates temptations to form more restricted special interest circles within MR. However, the interplay and sharing of concepts and ideas between the various areas of MR is so intense that the whole discipline is like an oriental carpet and there is no simple way of cutting it into smaller sections without causing a substantial damage to the fabric (the tentative classification on the left does not quite convey this).
Let us not forget the old adage that defines a "specialist" as one who can either read or write, but not both ...
|
January 1, 2009

| Happy New Year 2009
I apologize for the fact that this entry is belated (it is already January 26). The reason is that I was half broken (see the photo) and badly pressed with my work on software for & with my Spanish friends at Mestrelab. Which does not mean that I intend to slow down my activity on this "blog" of mine (it is more a kind of e-zine, really). Quite the opposite! While I had to split last year's entries into two permanent pages (2008a and 2008b) for the permanent archive, this year I plan four such Sections - one per each Quarter.
It looks like the forthcoming year might be momentous. There is the economic depression, of course, but the term crisis can be also intended as challenge, and overcoming challenges is the only thing that makes humanity progress along the path from tree-tops to the stars (and beyond). In the USA the election of Barak Obama, revolutionary on its own, combined with the necessity to handle the depression, opens a unique political possibility to modify for the better many paradigms of the US economic and political system. Not that the rest of the world does not need improvements, of course, but should the US take a lead and get listened to, 2009 might yet become the start of a new era. What role will Science play in this I can't say, but it certainly opens qualitatively new possibilities.
In Magnetic Resonance (MR) we have many, many things boiling in the kettles, so to say. Too many to be handled by the relatively few adepts! Even leaving aside applications (some of which very exciting) and concentrating on technology and methodology, there is a continuous progress on many fronts, such as basic sensitivity (new probe ideas and concepts), faster acquisition strategies (sparse/reduced sampling) with fewer artifacts (random/multiple rate sampling), simpler and less costly hardware (direct signal sampling with no IF, exploitation of new electronic chips), new ways of creating and delivering magnetization (DNP, hyperpolarization), new signal sensors (electric field detection, magnetic force detection, SQUIDs), sensor miniaturization (on-chip sensors), MR at distance (ex-situ MR, especially combined with spectroscopy in inhomogeneous fields), etc. NMR software is also making giant strides, both in spectroscopy (a drive towards automatic molecular structure verification/elucidation) and imaging. Most of these developments might take another decade to reach maturity, but I am sure that we will see substantial advances already during 2009 and I hope to be able to follow them and even participate in some of them.
At this occasion, allow me a personal comment about what I would like to tackle this year. Apart from continuing to follow Magnetic Resonances at a journalistic level, I am developing niches of deeper interest which permit me to combine MR with other hobbies: mathematics, basic physics, and software development.
I will certainly continue the drive towards automatic molecular structure verification and elucidation via NMR spectroscopy which took so much of my time in 2008 and which I feel is now getting near to practical results. Since part of this work was the simulation of NMR spectra of coupled systems of any size (the universal SpinSim package which is now operational), I want to develop the promised KTS (Know Thy Spins) series of more or less educational articles explaining various aspects of coupled spins spectra and the tricks developed to handle them efficiently. I will certainly continue also my work in the general area of noisy data handling which has led last year to algorithms like robust noise estimate, mean linewidth estimate, Resolution Booster, J-Correlator, BayDOSY, SnapLine, SnapGrid, etc. With Carlos Cobas and his team we have now implemented most of these into the Mnova software and it is time to describe somewhere their mathematical details, lest people think that we are engaged in an unholy black magic.
There is one private passion I will try to promote this year, which is the study of the properties of spin radiation and of its possible exploitation on scales from sub-planetary to astronomical. Considering that so far nobody has actually seen any spin radiation (at least there are serious doubts about this point) this may be a somewhat daring proposition. On the other hand, there is little doubt that MR is an electromagnetic-field spectroscopy, so there is no basic reason why it could not be be done remotely - with a remote transmitter and a remote detector - like any of its kin. I do not have the financial means to carry out lab experiments, but I will at least try and propose some which might be pertinent and interesting. My hope is that, on the theoretical side, MR might throw a new light on some of the many unsettled problems of quantum physics and, on the more practical side, permit one day to carry out NMR spectroscopy and MR imaging of remote magnetic systems on the Earth (storm systems, oceans), Jupiter (atmosphere) and Sun (sunspots plasma). Secretly I even hope that spin radiation - once we know how to distinguish it - might yet pop up in pulsars (fields up to 100 MT) and magnetars (100 GT) where Larmor frequencies spread beyond the visible light interval and invade the X-ray region. I will present a talk about some of these ideas at the 50th ENC, so if you always wanted to see a mad scientist but never got an opportunity, this is your best chance.
Should MRA (Magnetic Resonance Astronomy) never work, I will take a consolation in the following citation which my friend Roberto Gil (Mellon Institute) likes to attach to his e-mails. It is due to Benjamin Mays (American educator, Clergyman, 1895-1984):
The tragedy of life doesn't lie in not reaching your goal. The tragedy lies in having no goal to reach. It isn't a calamity to die with dreams unfilled, but it is a calamity not to dream. It is not disgrace not to reach the stars, but it is a disgrace to have no stars to reach for.
Well, I feel like I have enough stars for everybody. Just let us try and reach them!
|
|
Archive
| For a complete list of all entries since 2005, see the running INDEX
|
|
Visitor # 
ADVERTISE with us
NMR, MRI, ESR, NQR
Companies
Societies
Centres & Groups
Journals & Blogs
References
Free Texts
History
Links
BOOKS Lists
MATH | SOFTWARE
PHYSICS | CHEMISTRY
ELECTRONICS | DSP
WWW | Patents & IP
SPECTROSCOPY
MRI | NMR | ESR
Instruments
ARTICLES
Biography of F.C.Yu
Hebel-Slichter effect
MR Antenna Theorem
NMR Dead Time
One-Page MR Primer
K-space and MRI
S/N Perspectives
OTHER
SI Units &
Dimensions
Physics constants
Science Links

Support this site!
SHOP from here:
COMPUTERS:
Deals
Bestsellers
Accessories
Calculators
This page is
SPONSORED by:


Random offers:
|